Numbers · Published 2025-07-24 · 1 min read
Campaign report: months three and four
The first-month report, the second-month report.
🔧 Setup
- Optimisation: Purchase
- Period: 15 May – 15 July
- Niche: photo apps
📊 Results
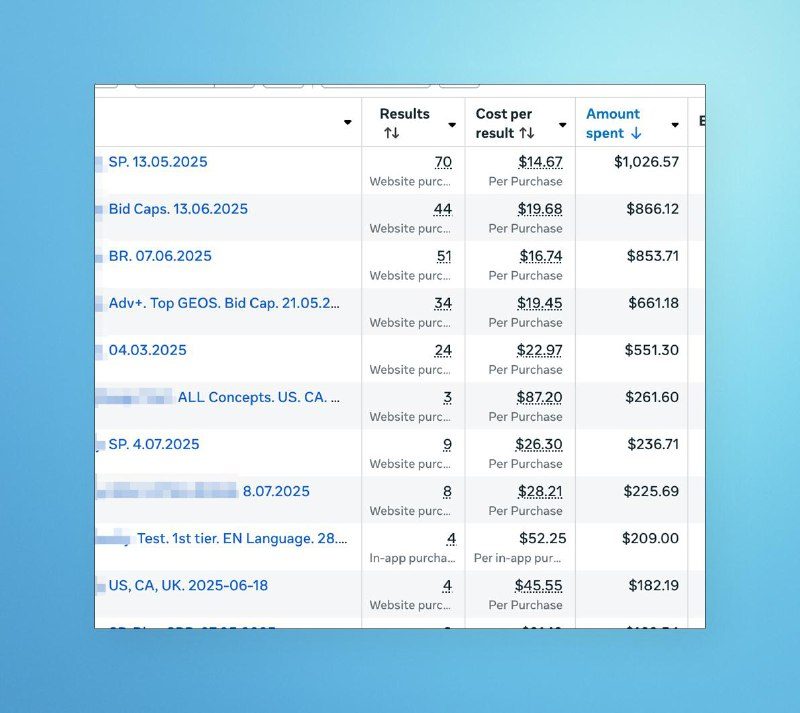
- GEO: US, CA, UK, SP, BR
- Spend: $7,200
- Purchases: 303
- CPA: $23
- 3-Day ROAS: 70%
- Profit: $0
- MRR: $2,000
💡 What I did
- Updated the app on the basis of the best creatives. Made the content as close to the creatives as possible.
Result: zero. Per-user LTV did not change.
- Launched localised creatives in Spanish and Portuguese.
Result: good. Both campaigns perform better than the English-language ones.
- Launched a CPP in Spanish and Portuguese.
Result: zero. The English ones perform just the same.
- Launched Bid Cap / Cost Cap.
Result: fine. Bid Cap burned out and stopped spending. Cost Cap consistently fails to stay inside the cap you set, but if you set a value below the KPI figure it does broadly stay inside the KPI. CPA per purchase is the same $23 as before.
🔥 Plans. On roughly the same set of campaigns, run A/B tests inside the app to find the optimal subscription price.
Want a launch like this? Write to me.