Numbers · Published 2026-07-21 · 1 min read
Cost per install is not a KPI
On Meta I optimise campaigns either for purchases or for trials. Optimising for installs does not work, and I do not look at the cost of an install when buying. As an aside: it does matter in Apple Search Ads. On Meta it does not.
Why CPI rises
Paying users cost more, and the cost of an install rises along with them. The job is not to buy a cheap install but to buy an install whose ROAS adds up.
The one case where I do look at it
An absurdly high CPI. An example. You launch. You look at the cost of an install: $30. Take an optimistic 10% conversion into purchase. That gives a cost per paying customer of $300. Open the RevenueCat report with KPIs by niche: prices like that do not exist in the mobile market. There is no optimistic scenario in which a $30 CPI pays back. I stop the campaign and look for new positioning.
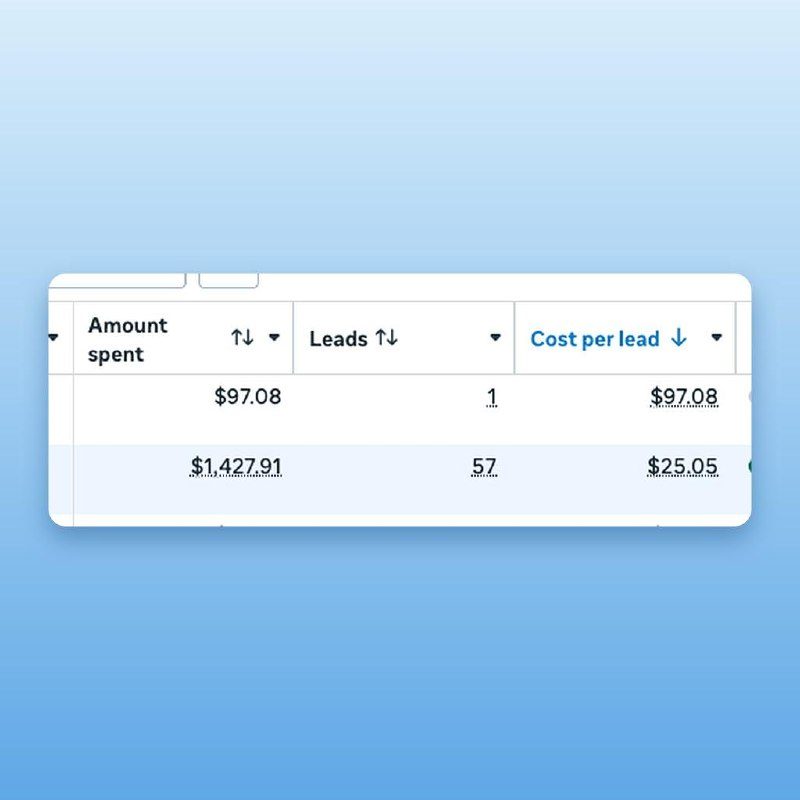
A note on the screenshot
This is a Web2App campaign. A direct link to the store is not a funnel. Lead is mapped onto install. $1,400 of spend, 57 leads, $25 per lead. Within this test I tried seven different positionings, and the install came out between $17 and $64. Off the back of the test I changed the custom product page in the App Store and changed how the app is positioned. To jump ahead: it helped.
Takeaway
I do not use cost per install as a KPI. But there are situations where it is useful to know it.